
Correction, 6 September 2026. The measurements and the lab did not change; three inferences were narrowed. The linear projection to 200 million rows was removed (one point does not give a curve), a note was added that the 1.7 emulation factor must not be used as a divisor, and the point that equal row counts do not mean equal results was added.
In the first part (in Turkish) I described the two open source layers for leaving Power BI. Superset is the face of the report, Doris the engine underneath. Every number I gave there came from documentation and vendor blogs.
In this part I built it myself. I generated a sales table of 20 million rows, loaded the same CSV into Doris, PostgreSQL and SQL Server 2025, ran six queries three times each, then connected Superset to Doris and built a dashboard. Every number below was measured on this machine.
Half of it did not go to plan, and I am writing that part too. The places where you get stuck rarely show up in blog posts, and they are what actually doubles the setup time.
The environment
MacBook, Apple Silicon, 16 GB RAM. I gave the Docker Desktop virtual machine 12 GB of memory, 8 CPUs and 120 GB of disk. Apache Doris 4.0.8 (1 FE + 1 BE), Apache Superset 6.1.0, PostgreSQL 16, SQL Server 2025 CU8 and Redis 7.
SQL Server comes with a caveat and it matters when reading the results. Microsoft publishes its image for amd64 only, so on Apple Silicon it runs under Rosetta emulation. Doris and PostgreSQL run natively on arm64. I measured the emulation penalty on the same machine: identical CPU work took 0.29 seconds in an amd64 container and 0.17 seconds on arm64, roughly 1.7x. Read the SQL Server numbers with that factor in mind. Do not use it as a divisor: 1.7 was measured on a single CPU workload and it does not correct every query by the same proportion. I/O, memory, query plans and parallelism are affected differently by emulation. This comparison describes one lab scenario: a single node, a laptop, two engines running natively on arm64 against one running under emulation, and a columnar store against a B-tree heavy setup. It is not a general ranking of the products.
The image sizes surprised me on the other side. Doris BE is 5.36 GB, FE 2.28 GB. Superset is 877 MB, PostgreSQL 474 MB. Doris alone means 7.6 GB to download, and in an office on a limited line you need to plan for that.
The data
Synthetic sales data: 20,000,000 rows, 11 columns, from 2023-01-01 to 2026-08-31. Alongside it a product dimension of 5,000 rows and a branch dimension of 120. Generating it in Python took 95.3 seconds and produced a 1.4 GB file.
The measurement was built on that. On the Doris side the table is DUPLICATE KEY(tarih, satis_id), with automatic range partitioning by month (44 partitions were created) and 8 buckets on satis_id. On the PostgreSQL side the same table plus three B-tree indexes for tarih, urun_id and sube_id. In other words each engine got its own natural setup.
Loading
| Step | Doris | PostgreSQL | SQL Server (emulated) |
|---|---|---|---|
| Raw load | 71.3 s (280k rows/s) | 30.8 s (650k rows/s) | 112.1 s (178k rows/s) |
| Index creation | none | 16.5 s (3 indexes) | 119.8 s (3 indexes) |
| Statistics | automatic | 1.9 s (VACUUM ANALYZE) | 47.0 s (FULLSCAN) |
| Until queryable | 71.3 s | 49.2 s | 278.9 s |
I did not expect that row. At pulling a single flat file in, the PostgreSQL COPY command beats Doris Stream Load. In that time Doris converts to columnar format, compresses and distributes across 44 partitions, so the comparison is not like for like. But the sentence "Doris is faster at everything" does not hold here.
On storage the table flips around:
| Engine | Table | Indexes | Total |
|---|---|---|---|
| SQL Server 2025 | 1,646 MB | 1,027 MB | 2,673 MB |
| PostgreSQL 16 | 1,863 MB | 399 MB | 2,263 MB |
| Apache Doris 4.0.8 | 367 MB | none | 367 MB |
That is 7.3x between Doris and SQL Server, and 6.2x between Doris and PostgreSQL. This is what columnar storage and compression are worth in concrete terms. A 2 GB difference at 20 million rows may look unimportant. At 2 billion rows the same ratio is 200 GB, and it grows your backup and replication cost together.
The detail worth noticing is that SQL Server's indexes take up nearly two thirds of its table. The same three indexes come to 399 MB on PostgreSQL.
Query times
Six queries, three runs each, with the Doris SQL cache turned off. The first run is cold, the best run is warm.
| Query | Doris | PostgreSQL | SQL Server (emulated) |
|---|---|---|---|
| Monthly revenue (full table aggregation) | 1.40 s | 2.79 s | 7.95 s |
| Category x brand (join + group by) | 1.11 s | 2.53 s | 6.42 s |
| Region x channel (join, last 12 months) | 0.45 s | 1.02 s | 5.39 s |
| Monthly unique customers (count distinct) | 1.72 s | 9.08 s | 6.28 s |
| Filtered top 100 (sorting) | 0.15 s | 1.24 s | 5.67 s |
| Single day point query | 0.02 s | 0.03 s | 0.12 s |
| Total | 4.85 s | 16.68 s | 31.83 s |
I verified one by one that all three engines returned the same row counts on all six queries (44, 20, 24, 44, 100 and 1 rows). Why that matters is in item seven below.
Single node, a laptop, 20 million rows. Under those conditions Doris came out 3.4x faster than PostgreSQL. The 18x to 34x figures vendor blogs talk about are not here, because those are measured at billion row scale on multi node clusters.
Do not read SQL Server's 31.83 seconds at face value. That engine is running under emulation and the rough penalty I measured is 1.7x. Divide and you land around 19 seconds, meaning it would be in the same class as PostgreSQL if it ran natively. The conclusion that Doris is clearly faster than both survives that correction.
Three outliers are interesting. On the single day point query Doris and PostgreSQL are nearly level (0.02 s against 0.03 s), because a B-tree index exists for exactly this job. On unique customer counting PostgreSQL climbs to 9.08 seconds and falls behind even the emulated SQL Server; count(DISTINCT) is a weak spot for PostgreSQL. On filtered sorting Doris passes the others by a wide margin at 0.15 seconds.
So the decision to "go with Doris" is not made by the average speed. It is made by which query type dominates your dashboard.
The Superset side
Connecting Doris to Superset takes the sqlalchemy-doris driver and this connection string:
doris://root:@172.28.10.2:9030/dwh
Creating a database connection, a dataset, four charts and a dashboard through the API took 1.02 seconds. Superset's initial setup (schema migration, admin user, roles) took 21 seconds.
The dashboard genuinely worked, drawing 225 billion in revenue, a 44 month trend and a channel breakdown across 20 million rows.
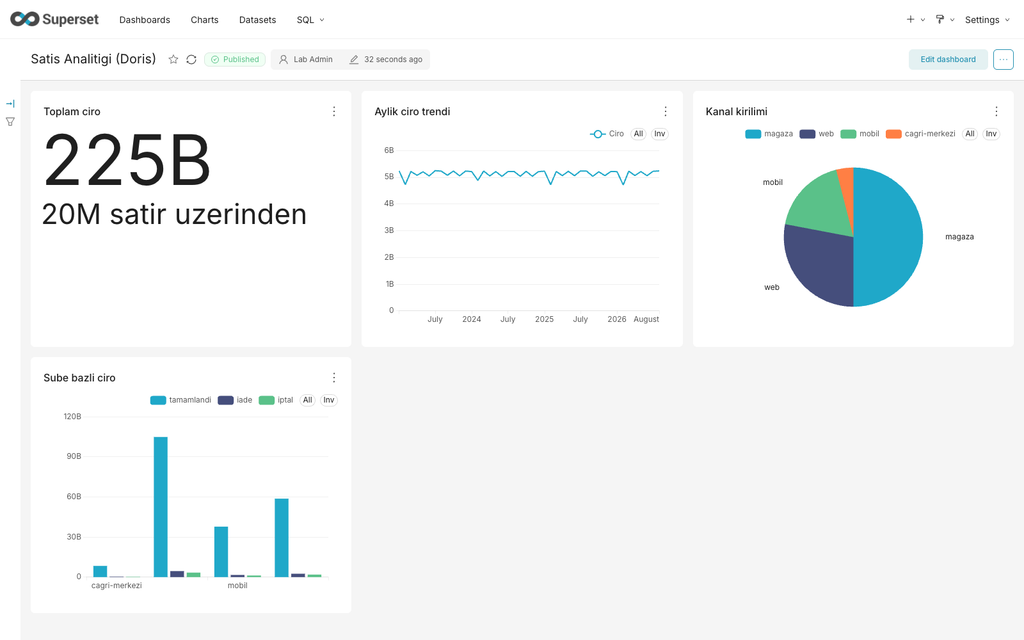
The Apache Superset dashboard. All four charts are produced from the 20 million row sales table on Apache Doris underneath. Total revenue 225 billion, 44 month trend.
SQL Lab also listed the Doris schemas and returned the query containing date_trunc and count(DISTINCT) correctly.
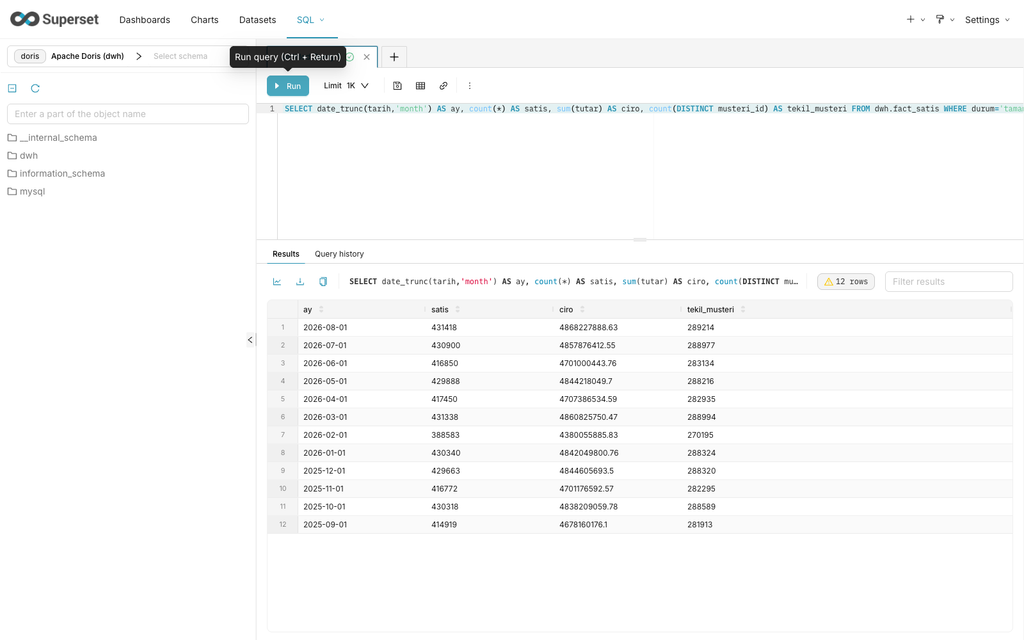
Superset SQL Lab, running monthly revenue and unique customer queries on Apache Doris. The Doris schema tree is visible on the left.
The data timings for the charts:
| Chart | 1st request | 2nd request | 3rd request |
|---|---|---|---|
| Total revenue | 4.91 s | 0.77 s | 0.11 s |
| Monthly revenue trend | 3.32 s | 0.20 s | 0.11 s |
| Channel breakdown | 2.67 s | 0.58 s | 0.35 s |
| Status x channel | 3.03 s | 0.23 s | 0.17 s |
The 3 to 5 seconds on the first request is Superset's own overhead plus a cold Doris. Once warm it drops to 0.11 seconds, because the Doris SQL cache is in play. The real user experience sits somewhere between those two numbers.
The SQL Server side: does it connect?
So far I compared Doris against PostgreSQL, because PostgreSQL was the migration target I recommended in the first part. But the source system of an organisation making the move is SQL Server, and the natural question is whether this stack talks to it.
I tried in three places and all three worked.
Superset connects directly to SQL Server. Adding pymssql to the image is enough, the connection string is mssql+pymssql://sa:password@host:1433/dwh. It connected and counted the 20 million rows. The one wrinkle is that SQLAlchemy 1.4.54 does not recognise the SQL Server 2025 version number (17.0.4075.5). It warns, it does not block.
Doris queries SQL Server without copying the data. You set up a JDBC catalog:
CREATE CATALOG sqlserver_kaynak PROPERTIES (
  'type'='jdbc',
  'user'='sa',
  'password'='...',
  'jdbc_url'='jdbc:sqlserver://host:1433;DataBaseName=dwh;encrypt=false;trustServerCertificate=true',
  'driver_url'='file:///opt/apache-doris/plugins/jdbc_drivers/mssql-jdbc.jar',
  'driver_class'='com.microsoft.sqlserver.jdbc.SQLServerDriver'
);
The driver jar has to go into both the FE and the BE container, one side is not enough. After that you query it as sqlserver_kaynak.dbo.fact_satis. A three month channel breakdown came back in 7.82 seconds.
The really interesting one is the cross catalog query. I joined a local dimension table in Doris with the fact table in SQL Server:
SELECT u.kategori, count(*) AS adet, sum(f.tutar) AS ciro
FROM sqlserver_kaynak.dbo.fact_satis f
JOIN dwh.dim_urun u ON f.urun_id = u.urun_id
WHERE f.tarih >= '2026-07-01'
GROUP BY u.kategori;
It returned in 8.78 seconds. During a migration that is worth a great deal. You can leave the old warehouse in place, read across it and move gradually, rather than having to move everything first and write the reports afterwards.
On the measurement side I put SQL Server in the results table, with the emulation caveat. That is the third column above. Assume a natively running SQL Server would do clearly better than these numbers.
The seven places I got stuck
This is the section that doubles the setup time.
1. The official Superset image has no PostgreSQL driver. The container starts, says ModuleNotFoundError: No module named 'psycopg2' and dies. It cannot connect to its own metadata database. You have to write a derived image that adds psycopg2-binary and pydoris. For me that took 13 seconds, but the "pull the official image and run" expectation ends right here.
2. Doris Stream Load redirects to the container's internal IP. When I sent the load to the FE port 8030, it returned HTTP 307 pointing at the BE's internal address (172.28.10.3:8040), and since the host cannot reach that it silently returned an empty response. 75 seconds wasted. The fix is to send straight to the BE's published port.
3. Docker's default 64 MB /dev/shm stops PostgreSQL. could not resize shared memory segment to 67145376 bytes: No space left on device. The dynamic shared memory needed for parallel query does not fit. You need shm_size: 1gb and it is not the default in a compose file.
4. postgres:16-alpine crashes on arm64 with a large table. Every query doing a full scan gets server process was terminated by signal 7: Bus error and it goes into recovery. With the same data on the Debian based postgres:16 image there was not a single problem. If you are on Apple Silicon, do not use the alpine variant for a data warehouse test.
5. The Doris SQL cache is on by default and it lies to your measurement. On my first round the warm runs showed 0.00 seconds. A 20 million row aggregation does not finish in 10 milliseconds. enable_sql_cache defaults to true, and every comparison you make without turning it off is rubbish. With it off the same query came back at 1.40 seconds.
6. Doris BE cancelled the count(DISTINCT) query with 3 GB of memory. MEM_LIMIT_EXCEEDED, process memory over the 2.41 GB limit. Turning on the spill-to-disk feature from the 4.0 announcement did not save it either, because the process was already at the limit and had nowhere to spill to. After restarting BE the same query finished in 1.46 seconds. Doris memory management is not as forgiving as PostgreSQL's, so take the recommended 16 GB per BE in production seriously.
7. My measurement came out silently wrong, and I would not have noticed without counting rows. My data generator wrote the CSV with \r\n line endings. The PostgreSQL COPY command and the Doris Stream Load both stripped the \r. The SQL Server BULK INSERT did not, because I had given it ROWTERMINATOR='0x0a'. On SQL Server the durum field became 11 characters, everywhere else 10. Three queries filtering on durum='tamamlandi' returned the empty set, were measured without raising an error, and the timings looked plausible. It only surfaced when I checked the result row counts. I reloaded with ROWTERMINATOR='0x0d0a' and confirmed all three engines returned the same counts. Anyone running a comparison should record row counts next to the timings. One warning to myself as well: matching row counts do not prove matching results. Here it saved me because the bug produced an empty set. But if a sum or an average were wrong, the row count would still match and the error would stay invisible. If you want the measurement to hold, compare the values too, with a sensible tolerance on floating point.
As a bonus: keeping the PostgreSQL data directory on a macOS bind mount made COPY take 53.1 seconds. The same work on a Docker named volume took 30.8 seconds. Nearly double.
What I learned
The Doris installation is cleaner than I expected. Two processes, no ZooKeeper, no separate coordinator, you connect with a MySQL client and work. Superset turned out dirtier than I expected, because the official image ships without drivers and for production you have to keep five pieces alive.
On the query side Doris is clearly fast, but the size of the gap depends on the query type. On an indexed point query PostgreSQL catches up, on heavy aggregation the gap opens. On count(DISTINCT) PostgreSQL falls behind even the emulated SQL Server. On storage there is 7.3x between Doris and SQL Server, and as scale grows that turns into a hardware bill.
On the SQL Server side both Superset and Doris connect, and Doris can query the old warehouse without copying it. You do not have to do the migration in one go.
At 20 million rows PostgreSQL is still perfectly usable, with a worst query of 9 seconds. That is the point I measured, and one point does not give you a curve. Assuming ten times the data costs ten times the seconds would be wrong: once a memory threshold is crossed, a plan changes, or the working set spills to disk, the curve bends, and it usually bends the wrong way. What I can say is that on this hardware the dashboard still opens at 20 million rows, and PostgreSQL is already at 9 seconds on its worst query. Where your own threshold sits is something you have to measure on your own data, which is exactly why the lab is open source.
Build the lab on your own machine
You do not have to take my numbers on faith, produce your own on your own hardware. I published the whole lab as open source: the compose file, the data generator, the DDL for all three engines, the measurement scripts, the Superset setup and the SQL Server federation.
github.com/dmcteknoloji/doris-superset-lab
git clone https://github.com/dmcteknoloji/doris-superset-lab.git
cd doris-superset-lab
bash kur.sh
It sets everything up in eight steps: kernel setting, Superset image, containers, schemas, data generation, loading into three engines, indexes and statistics. The default is 20 million rows, and you can shrink it with bash kur.sh 2000000. The Docker virtual machine needs 10 GB of memory and 60 GB of free disk, and the first run pulls about 9 GB of images.
After that bash olc.sh and bash olc-mssql.sh run the measurement, and python3 superset-kur.py builds the dashboard. The README in the repository also covers all seven items above and their fixes.
If anyone runs it on an x86 server I would like to see the numbers, because there all three engines are native and the SQL Server column loses the emulation penalty.
Frequently asked questions
How much faster is Apache Doris than PostgreSQL and SQL Server?
At 20 million rows, on a single node at laptop scale, it came out 3.4x faster than PostgreSQL across the total of six queries. SQL Server is not directly comparable because it runs under emulation; correcting for the emulation penalty puts it in the same class as PostgreSQL. The gap varies by query type.
Which engine wins on which query?
On the indexed single day query Doris and PostgreSQL are nearly level. On unique customer counting PostgreSQL climbs to 9.08 seconds and falls behind even the emulated SQL Server. On filtered sorting Doris leads by a wide margin at 0.15 seconds.
How much disk does Apache Doris use?
The same 20 million rows took 367 MB on Doris, 2,263 MB on PostgreSQL including table and indexes, and 2,673 MB on SQL Server. That is 7.3x between Doris and SQL Server.
Can Apache Doris query SQL Server?
Yes. With a JDBC catalog set up it can query tables in SQL Server without copying the data. Joining a local dimension table in Doris with a fact table in SQL Server in a single query works too. The driver jar has to be placed in both the FE and the BE container.
Why does the official Superset Docker image exit immediately?
The official image does not include the PostgreSQL driver and dies with a ModuleNotFoundError before it can connect to its own metadata database. You need to build a derived image that adds psycopg2-binary.
Can I build this lab myself?
Yes, all of it is open source. Clone github.com/dmcteknoloji/doris-superset-lab and run bash kur.sh. The Docker virtual machine needs 10 GB of memory and 60 GB of free disk.
If you would like to do this work together
At DMC Bilgi Teknolojileri we have worked on SQL Server and databases for more than fifteen years. When someone asks about leaving Power BI, we start by putting the scope into numbers rather than by recommending a product. How many Power BI reports, how many SSRS reports, how many SSIS packages, how many DAX measures, how many active users, which data sources.
Any schedule given before the layer underneath is visible is a guess, and migration projects usually stall at exactly that point.
What we do: SQL Server health and security assessment, migration from SQL Server to PostgreSQL, redesigning the data warehouse, moving the reporting layer, and managed DBA service after that. The assessment phase is short and concrete, and what comes out of it is a list of findings and a schedule.
iletisim@dmcteknoloji.com · dmcteknoloji.com · +90 212 945 61 66